
1. Introduction:
There are already over 250 standard Reports in the system, including many extended BI Code reports. However, it is impossible for any system to supply a set of standard reports that completely meets the diverse needs of all businesses and business owners. To address this and to further provide users with increased power and flexibility when it comes to analysing and presenting their data, the system also includes an extensive set of tools delivered as an Excel Add-in. Using this Add-In you can then deploy the full capabilities of Excel to enhance your Analysis and Reporting - including the free Power Pivot addition to Excel.
The Excel Add-In is particularly powerful if you analyse your business data using the Extended Business Analysis user-defined BI Codes including Dimensions and Elements. For example, you can use these codes to provide analysis by Division and/or Location and/or Activity and/or Product and/or Project, etc. and any combination of these. For further information regarding these analysis coding features refer to the Articles entitled; How do I Implement Extended Business Analysis, How do I Implement Job or Project Analysis,and How do I Produce my Extended Business Analysis Reports.
With the Add-In you can access your Database from Excel and extract data from the Database onto your PC. The system provides a number of pre-defined Database “Views” including Transactions, Sales Analyses, Purchase Analyses, Income & Expenditure, etc. (others will be added over time and extended based on user requests). It allows you to nominate which Database View fields you want to extract and to Group fields (or not) in order to minimise the traffic on your local network. It also facilitates Date Selection Parameters before the extraction process begins. You can then use the features and facilities of Excel to create many Custom Reports and Charts which you can “Save” for subsequent re-use and “Refresh” every Month or Week as required.
2. Downloading and Installing the Excel Add-In:
The first time you use this facility you must “Download” the Add-in software from the central System onto your PC (If you have several PCs with several instances of Excel, you must do it for each one). After you Login, from the Menus, Go To >Analysis > Excel Add-in and Click on “Download Add-in” followed by “Open”;
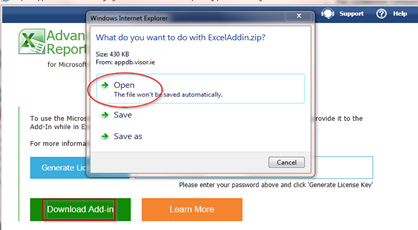
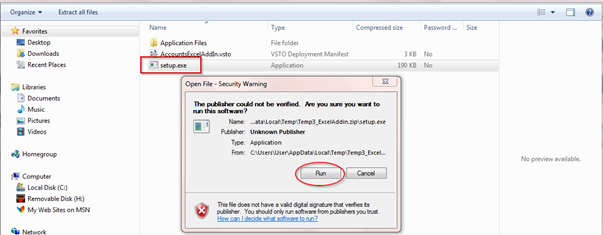
This will cause the following Window to open and you should Double Click on “Setup.exe” followed by “Run” to effect the Download;
Also, if this Window pops-up, Click on “Install”;
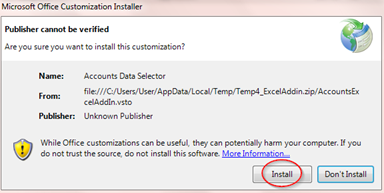
followed by “Close” after the Add-in Software has been successfully downloaded and installed on your PC. You do not need to repeat this step subsequently.
3. Establishing the Link between Excel and the System:
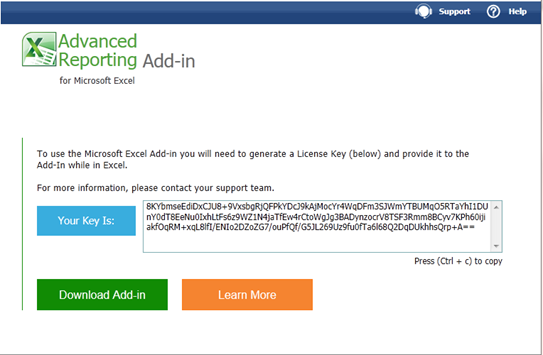
Enter your Login Password in the Box provided and Click on “Generate Licence Key”;
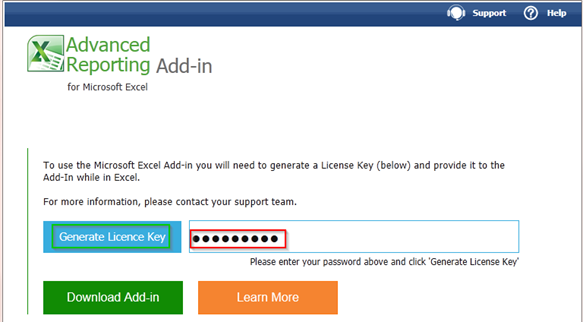
This will result in a long licence key being generated which you should then copy onto your Clip-Board using “Ctrl” + “C”;
Next, open up Excel on your PC and go to the “Add-Ins” Tab and Click on “Select Data” which invokes the following Window;
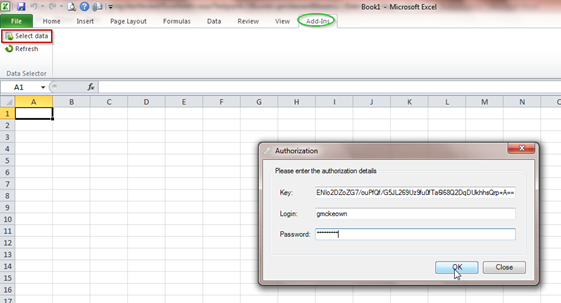
Paste (“Ctrl” + “V”) the Key into the box provided and Login in again. You are now connected from Excel to your Database.
N.B. If you can’t see the “Add-ins” Tab as highlighted here on this Excel Window you can rectify this by following the steps outlined in Section 9. below.
4. Extracting Data from your Database:
You are now presented with the following Window which displays the various available Database Views;
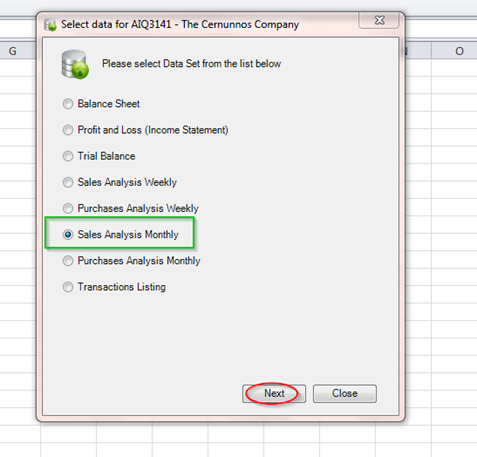
In this example, we are going to work with Monthly Sales Analysis data;
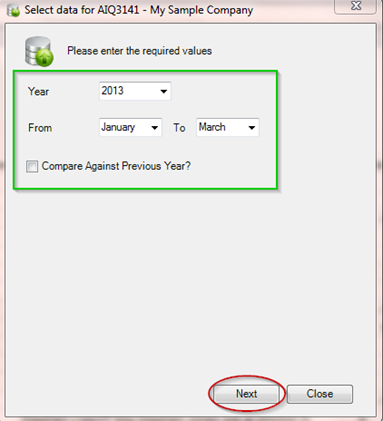
Depending on the Database View chosen, you will be first presented with some Parameters;
On this next Window you can now choose those data items (fields) which you wish to include in your data download;
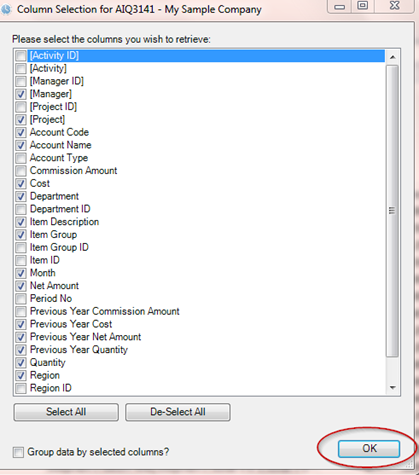
Having ticked the Columns (data items) you require, click on “OK”;
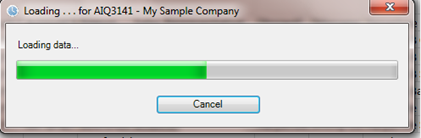 Where you will see the foregoing window, which when completed will have downloaded the requested data onto Sheet 1 or your Workbook.
5. Formatting your Report Pack:
The downloaded data items, together with their descriptive headings, will initially have their formats as used internally within the database itself – and, as such, may not be very suitable for Reporting purposes. For example;
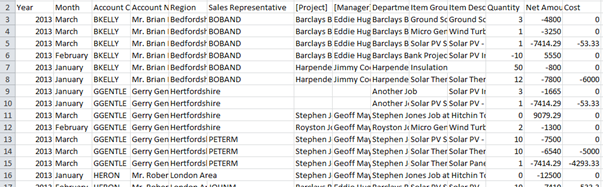
You should therefore copy the Columns you want to use to a second Spreadsheet in your Workbook and make any Excel formatting adjustments required in order to make the presentation more acceptable for Reporting purposes;
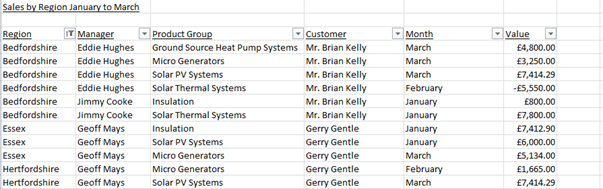
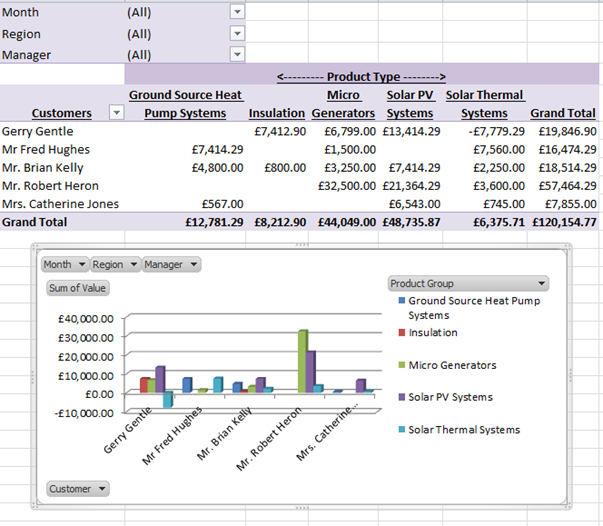
In addition, you can of course deploy all the many extensive features and facilities of Excel such as Sorting, Filtering, Formulas, Charting, Pivot Table presentation, etc., in order to refine your Reports and Charts into a re-usable Report pack. This example of Monthly Sales Analysis is just one of which can be accompanied by any number of others relating to other data sources such as Income & Expenditure, BI Code Analysis, Purchasing and so on. For example;
6. Saving and Re-Using a Report Pack:
When you have finished your fully formatted Report you should “Save” it in the normal way in a designated folder for subsequent re-use. When you want to re-use it, for example in the following month, recall and open the Excel Report first. Then go to the “Add-Ins” Tab and “Select Data” as heretofore. If you haven’t established the Link between the Database and Excel you may have go to your System and generate a Key – but if you already have, then the Key will be automatically presented and you just need to enter the login and password details.
The saved Report Data View will default to “Sales Analysis Monthly”. On the “Next” Screen you should now enter the new Date Range which you want the report to apply. On this “Next” Screen the previously chosen fields will be presented and on Clicking the “OK” button the reports and charts will be updated and produced using the new Date Selection Parameters you have chosen.
N.B. When you recall and open your “Saved” Excel Report Pack, Excel will default to the current open Spreadsheet when you last saved your Workbook. If you then download new or additional data, this will be downloaded into the current open page in Excel and may overwrite Reports or Charts if you haven’t got the correct Spreadsheet Page open on your workbook. Make sure that you open the first Spreadsheet to receive the data properly.
7. Using the "Refresh" Option:
The other option on the “Add-Ins” tab is the “Refresh” facility;
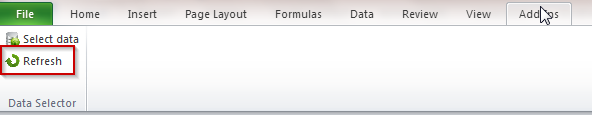
This button will execute a new download of transactions inclusive of any new transactions which have been entered into the system and which conform to the date and other parameters currently in place. Again, you should be careful to have the correct Spreadsheet in your Workbook open at the time of invoking the refresh.
8. Re-Installing the Add-In Software:
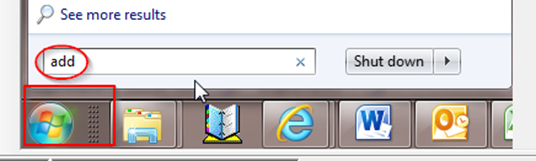
Should you require to re-install the Add-In Software for any reason, before following the procedure described in 2. above, you must carry out the following tasks first in order to de-install the previous version: Click on the “Start” Button on you PC and type in “add” in the Search box;
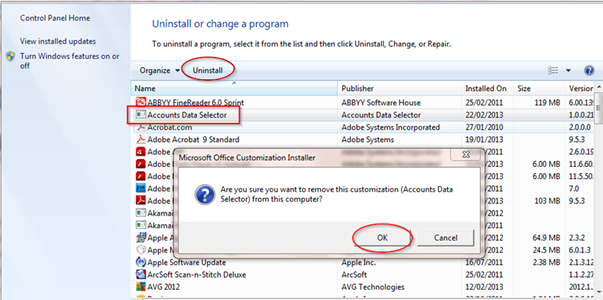
This will display the following, where you should choose “Add or remove programs”;
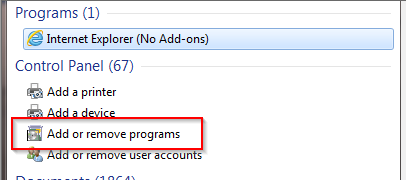
Locate the program entitled “Accounts Data Selector” and Click on “Uninstall” to begin the de-installation process;
You can now proceed to download and re-install the Add-in as described in Paragraph 2. above.
9. Can't see the ADD-Ins Tab?:
If the “Add-Ins” Tab isn’t displayed when you open Excel, you can rectify this as follows:
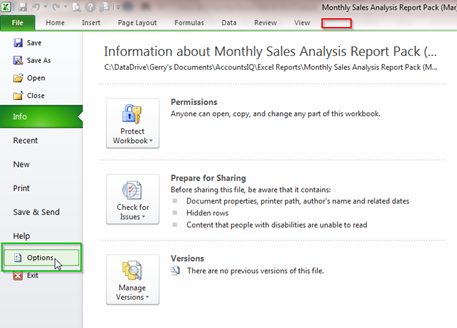
In Excel, click on “File” followed by “Options”;
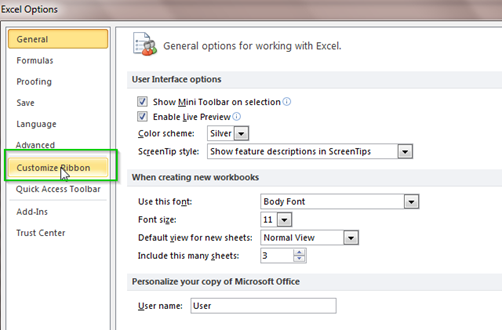
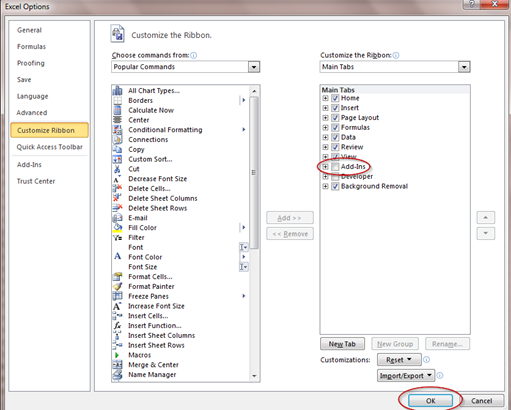
Now click on “Customize Ribbon” and tick the box marked “Add-Ins” followed by “OK”;
10. Excel Add-In Video:
Click on the following link to access a short video on this topic:
https://www.youtube.com/watch?v=VVAhuAvBbZY&t=15s