1. Introduction:
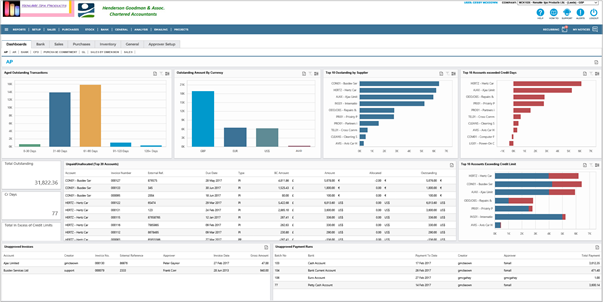
A comprehensive and extensive standard set of Dashboards is included in each of the various system modules listed below;
Most of these Dashboards are interactive in that they contain Drill-Down facilities for further in-depth examination of the data. Rather than fully describe each dashboard and its components in detail, it’s probably easiest just to highlight the features contained in one of them;
The Purchasing (AP) Dashboard consists of a system set of pre-defined Charts and Lists. These are the initial standard set provided with the system, but, given your particular industry or organisation type, if you have specific requirements and wish to add to them with your own-designed charts and lists, then your system provider will be glad to assist in the preparation of these.
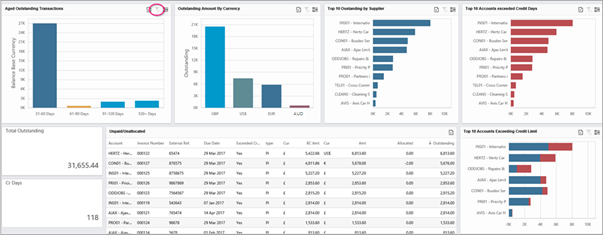
The Accounts Payable Dashboards relate principally to your outstanding indebtedness to your Company’s Suppliers (Vendors) and consist of analysis of the outstanding amounts owed under various categories along with information about pending Creditor Payment runs and, if PO approval is switched on in the system, a list of Purchase Invoices still awaiting approval. The AP Dashboards can be found here;
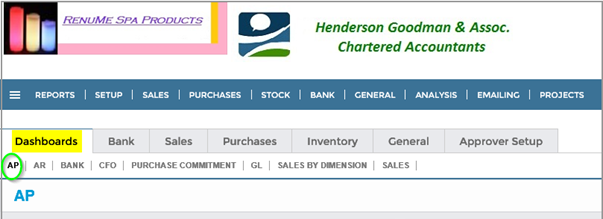
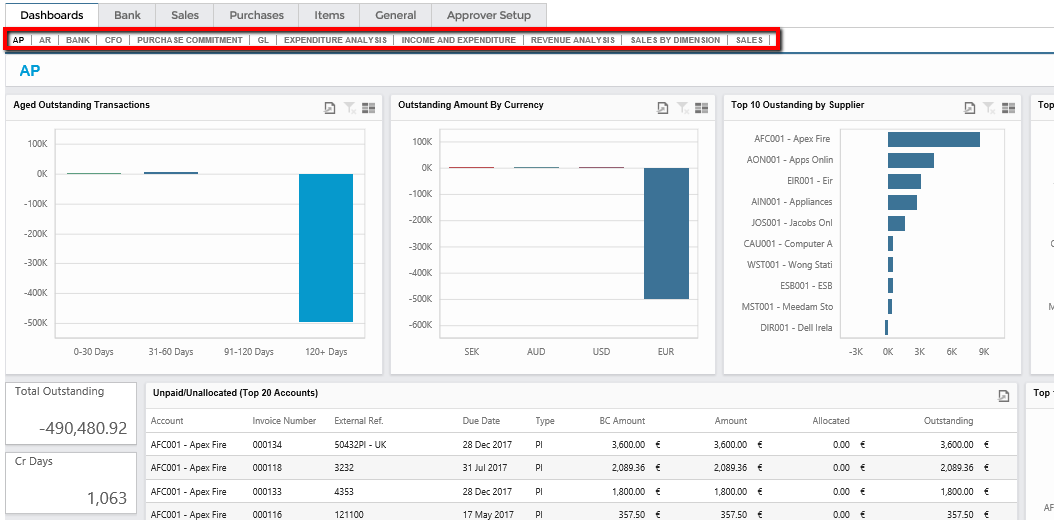
There may be a short delay when you click “Dashboards” as there is a great deal of information to be collected for presentation of all the Dashboards. When you click on “AP” the following set of Boards will then be presented;
2. Behaviour:
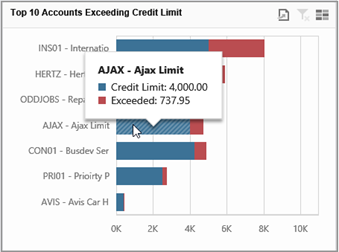
Many of the Dashboards are interconnected. For example, if you click on one of the Bars in any of the Bar Charts, this will cause the other Bar Charts to be “filtered” and modified according to the contents of the first Bar clicked. For example, if you click on the 31-60 days bar in the “Aged Outstanding Transactions” chart, then the contents of all the other bar charts will reflect only those outstanding transactions complying with the aged analysis of 31 to 60 days.
In addition, the “Unpaid/Unallocated” Transaction List will only show those transactions making up a particular Bar in a particular Chart. If no Bar is clicked then this list will show the Top Twenty Accounts in Account sequence order initially.
Hovering over a Bar will display the values contained therein;
3. Tools:
There are a number of common symbols and tools which are used extensively throughout the Dashboard set;
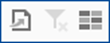
The first symbol shown here, when clicked, will result in a Drop Down showing “Export to PDF”, “Export to Image” and “Export to Excel or CSV”;
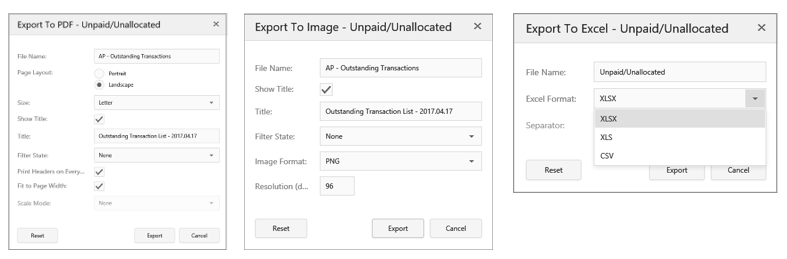
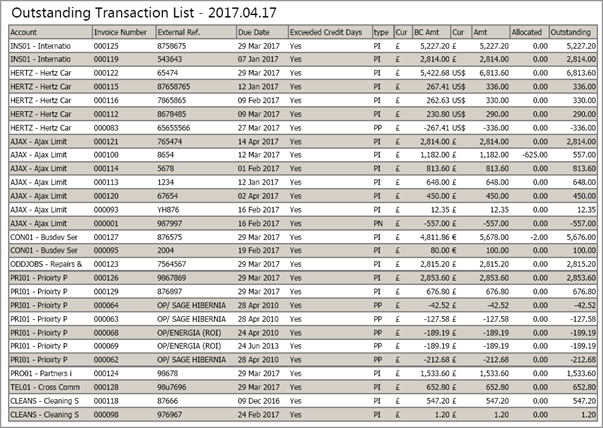
The following is an example of the export of the Transaction List to PDF;
The second tool shown above; i.e. this symbol (empty wine glass) is used to clear filters. When you click on any Bar in any of the Charts, the remaining charts and the transaction list are “informed” by the contents of the clicked Bar - as described previously. In the Chart containing the Clicked Bar, the symbol changes to; (full wine glass). Click on it again to remove the filter from that Chart and all the other Charts. Here’s an example where I am clicking on the 31 – 60 days Bar;
Before;
And After;
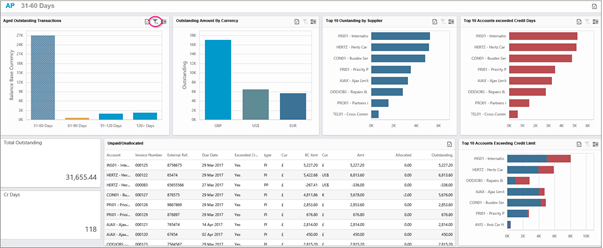
Click on the symbol (wine glass) to restore the set of Charts to the “Before” state.
The third symbol, (looks like a stack of bricks) is called “Multi-Select”, acts as a compound filter. When clicked, this allows you to select several bars in a single chart for filtering in combination. Again, click on the wine glass symbol to undo the selection.
You can also click on several Bars from multiple Charts to create a compound filter. For example you might want to list those transactions which are Euro only and which also fall into the 31 – 60 days category. In this case you will have to click on the wine glass symbol in both charts to clear the filter.
4. Sliders and Sorting:
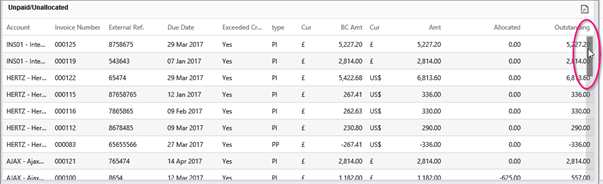
With regard to the transaction lists and other displayed lists, if necessary, a Slider will automatically appear when you hover in the right hand side of the particular Board in order to allow you to scroll down the relevant list. For example;
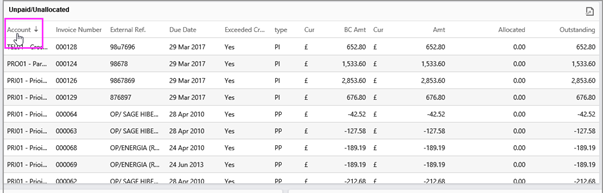
You can also sort on any of the displayed columns in any of these displayed lists. Simply click on the Column Header once;
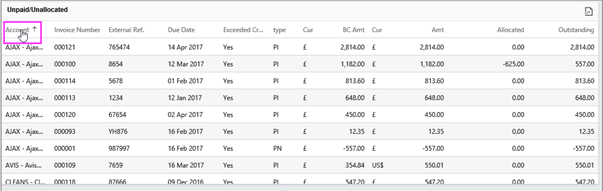
And click again to reverse the sort sequence;